
“Inflation is when you pay fifteen dollars for the ten-dollar haircut you used to get for five dollars when you had hair.” — Sam Ewing
The markets have been experiencing a high level of volatility this year, and we wanted to provide you with some commentary, as well as our perspective, on what is happening and what to expect going forward.
Background
In response to the COVID-19 pandemic, the Federal Reserve and the U.S. government injected a combined ~$13 trillion into the economy while simultaneously mandating that Americans essentially shelter in place/stay home. Milton Friedman famously said,
“Inflation is always and everywhere a monetary phenomenon in the sense that it is and can be produced only by a more rapid increase in the quantity of money than in output.”
Creating a historic amount of money while also experiencing a historic drop in the output of goods was the primary cause of the inflation we are currently experiencing, and it happened not only in the U.S. but around the globe. But that is the past. Where are we now, and what should we expect going forward? Here are some factors to consider as we move through the rest of the year and beyond:
- China is currently experiencing another serious COVID lockdown. This is temporary, but it is exacerbating the supply-chain disruptions that have been fueling recent inflationary readings. As this abates over the remainder of the year, it should help ease inflationary pressures.
- The Russia-Ukraine war—aside from the most important humanitarian considerations—is also creating additional supply-chain disruptions, increases in energy costs, and other inflationary pressures that still have a way to go before they are fully digested by the global financial system. Any decrease in the hostilities through the end of the year will ultimately help on the inflation front.
- The Federal Reserve is on full inflation management duty as we have seen from the recent 50 basis point rate hike and their telegraphing that there are more rate hikes ahead. However, the Fed will be watching inflation closely, and once we start seeing inflation decelerate below the current elevated expectations, it should give the Fed the latitude to pivot to a less aggressive policy stance.
Inflation
Inflation can be a tricky subject as it has to do with future changes. For example, if you recently paid $6.50 for a gallon of gas, you are seeing the effects of inflation. It is not pleasant. However, if you hypothetically have to pay $6.50 for a gallon of gas one year from now, it will still be unpleasant, but that would reflect a year-over-year inflation rate of 0% on fuel. It is easy to imagine a world where all of the container ships at all of the global ports are unloaded with the ports once again running smoothly. It is also easy to imagine a world where there are no microchip shortages because everyone is back to work and producing goods at a breakneck pace. The same can be said for an end to COVID lockdowns in China and an easing of tensions around the Russia-Ukraine war. What is not easy to imagine is that any of these things will happen overnight. This process will take time to see how/if/when these situations unwind, and a worsening of any of these conditions could extend the recovery and create additional volatility for financial markets.
The Markets
As of May 20, 2022, the S&P 500 is down -18.14% and the NASDAQ Composite is down -27.42% year-to date on a price basis. Excluding periods like the dot-com tech bust in 2000 and the Global Financial Crisis in 2008, this falls within the historical ranges for markets that are not experiencing long-term structural bear markets. The chart below illustrates what we are talking about:
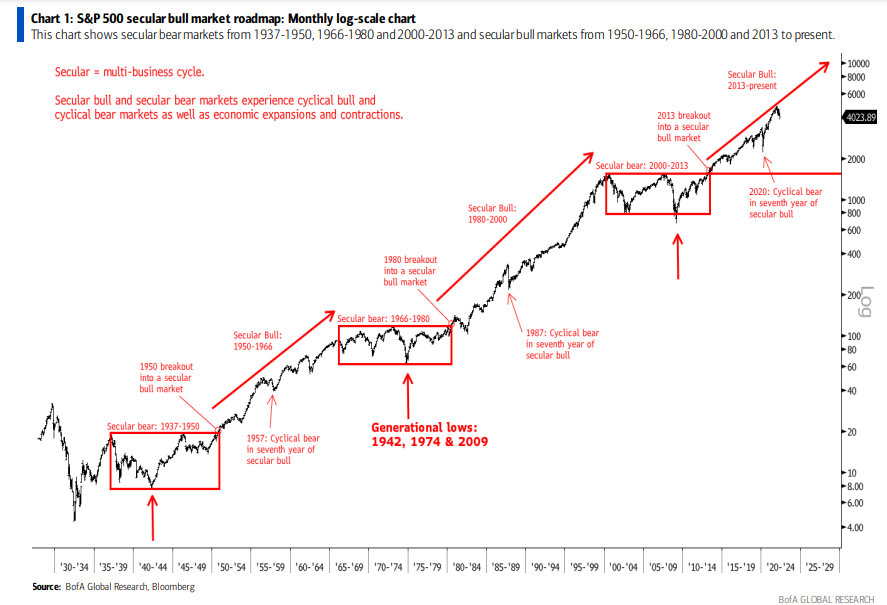 Figure 1 – S&P 500 Secular Bull Market Roadmap (Monthly Log-Scale Chart)
Source: BofA Global Research, Bloomberg
Nothing is ever certain, and the details are always different from one crisis to the next; however, we believe the Fed will ultimately be successful in bringing inflation down and that many of the mechanisms to do so are already in place (even if it will take some time).
There is a lot of talk about a recession and not all recessions impact the economy in the same way, so it is important to consider what type of a recession we may be facing. In 2008, U.S. GDP fell -8.5%, and S&P 500 EPS fell by more than -75% (source)! We do not believe we will experience that type of a recession. The world is still in the reopening phase, and businesses are continuing to get back to normal. Hundreds of ships are sitting at ports around the world waiting to be unloaded. We still have a long way to go, but that is constructive, and the consumer is very healthy going into this period. This all suggests to us that if there is a recession, it should be moderate. Although, any slowdown whatsoever is of course not fun for anyone.
The market generally anticipates these changes in the business cycle, as we noted in our last investment letter, and this is depicted on the following chart by the orange curve, representing the market, and the blue curve, representing the business cycle. This chart illustrates why we have made some adjustments to many of the portfolios away from the more cyclical sectors to more defensive areas like consumer staples, health care, and utilities.
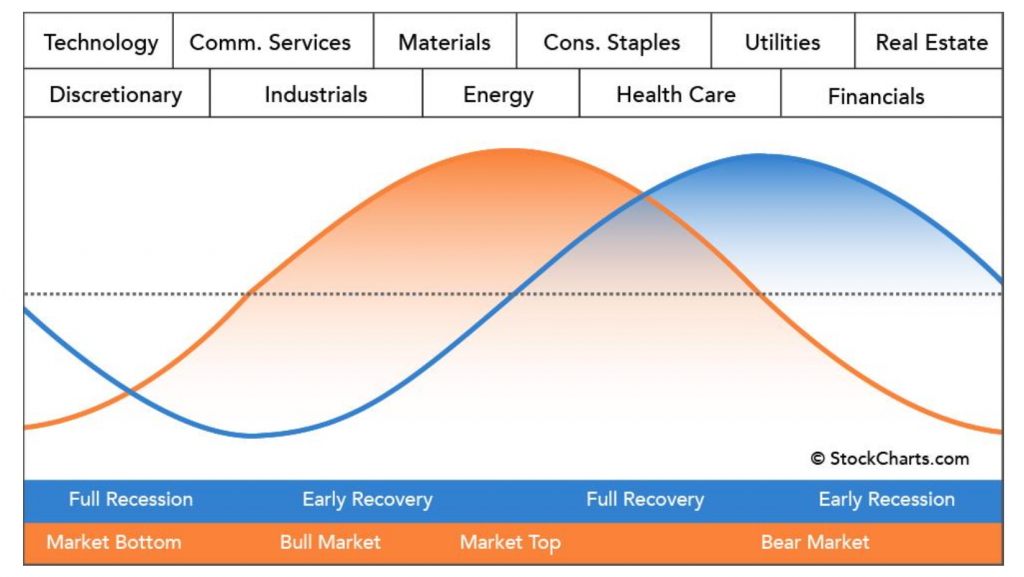 Figure 2 – Sector Cycle
Source: StockCharts.com
The market is already down substantially this year, and we believe we are closer to the bottom of this move. Given our expectations for some relief in the back half the year as all of these factors continue to play out, we would expect the market to establish a new range as it sorts out all of the competing variables. We are in the middle of that process now, and while we expect more volatility, there will also be rallies and a continuation of what may be a sawtooth pattern through the rest of the year. Any opportunity for the Fed to pivot to a less aggressive monetary policy in the next few quarters should also be greeted favorably by the market. There is some historical precedent for recovery in other years that have gotten off to a rocky start like this one. The charts below show prior years that began on negative footing tended to perform better throughout the remainder. It’s a small data set, but at least it is a positive:
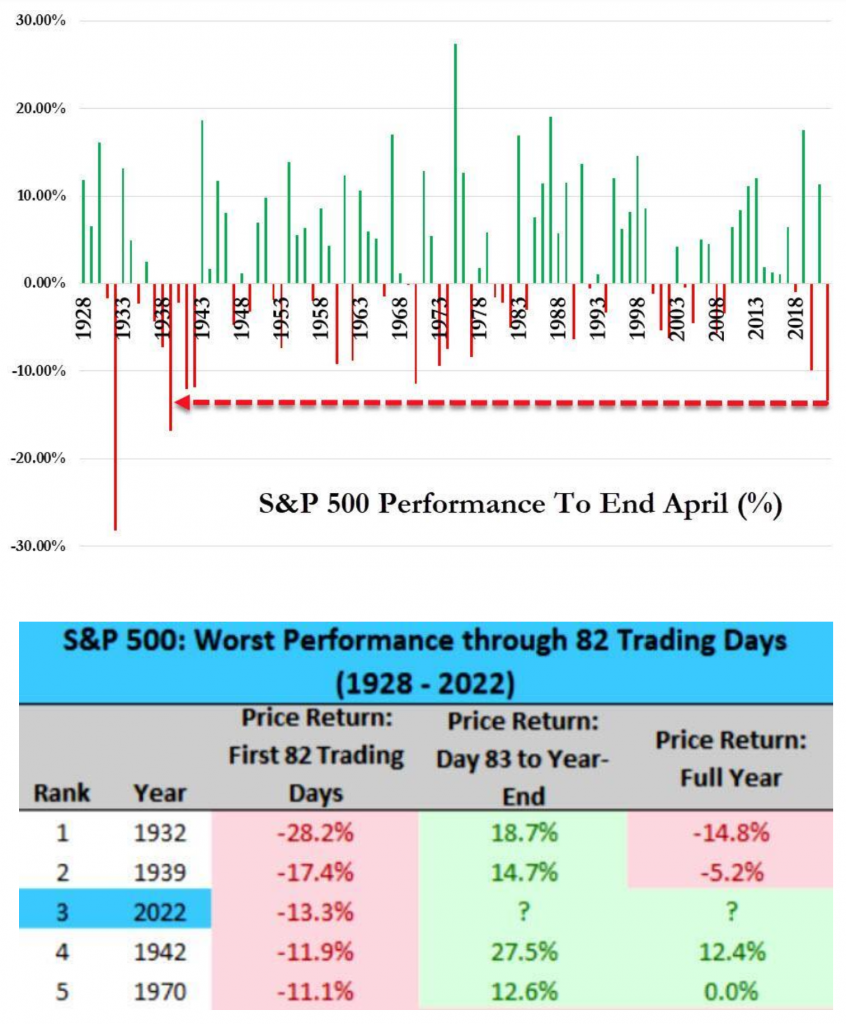 Figure 3 – Drawdown Recoveries
Source: The Market Ear
Finally, if you look at the market graphic above, it is clear that adding to high-quality securities when the market has sold off has been a successful approach over the long term. This is being accomplished at the firm through the reinvestment of dividends and the addition of cash when appropriate, and we do not believe it makes sense generally to radically alter your asset allocation at this point. Every portfolio is different, so make sure to talk to your ACI advisor about your specific situation, along with your goals and risk tolerance as we navigate this volatility. We are staying the course and looking to generally add high-quality securities, many with strong dividends, as we work our way through this challenging period. We will keep you posted as usual, but please let us know if you need a review prior to your regularly scheduled update.
Disclaimer: Historical performance results for investment indices and/or categories generally do not reflect the deduction of transaction and/or custodial charges or the deduction of an investment-management fee, the incurrence of which would have the effect of decreasing historical performance results. Economic factors, market conditions, and investment strategies will affect the performance of any portfolio, and there are no assurances that it will match or outperform any particular benchmark. The Standard & Poor’s 500 Index – S&P 500 is a market capitalization weighted index of 500 large U.S. publicly traded companies by market value. The S&P 500 is one of the most common benchmarks for the broader U.S. equity markets. Indices are unmanaged, do not incur fees and expenses, and cannot be invested in directly. Indices do not reflect the payment of advisory fees and other expenses associated with an exchange-traded fund.