
There are always a myriad of factors affecting the markets. We look at unemployment, GDP, corporate earnings, and scores of other metrics to help tease out the direction of the next major market move. Right now, inflation is the 10,000-pound elephant in the room, and China reopening after reversing their “COVID-Zero” policy, along with the depth of a potential recession in the U.S. and the war in Ukraine (among other factors), are all important considerations. One could argue, however, that none of these factors are or have been as significant to the ultimate direction of the markets as the actions of the Federal Reserve. Since Alan Greenspan began using monetary policy to control and shorten the business cycle in the 1980s, the actions of the Fed have become one of the single most important factors to monitor when determining intermediate-term market direction. Let’s take a deeper look at the chart below to see how the actions of the Fed have caused massive distortions and overshoots in the markets over just the last few years.
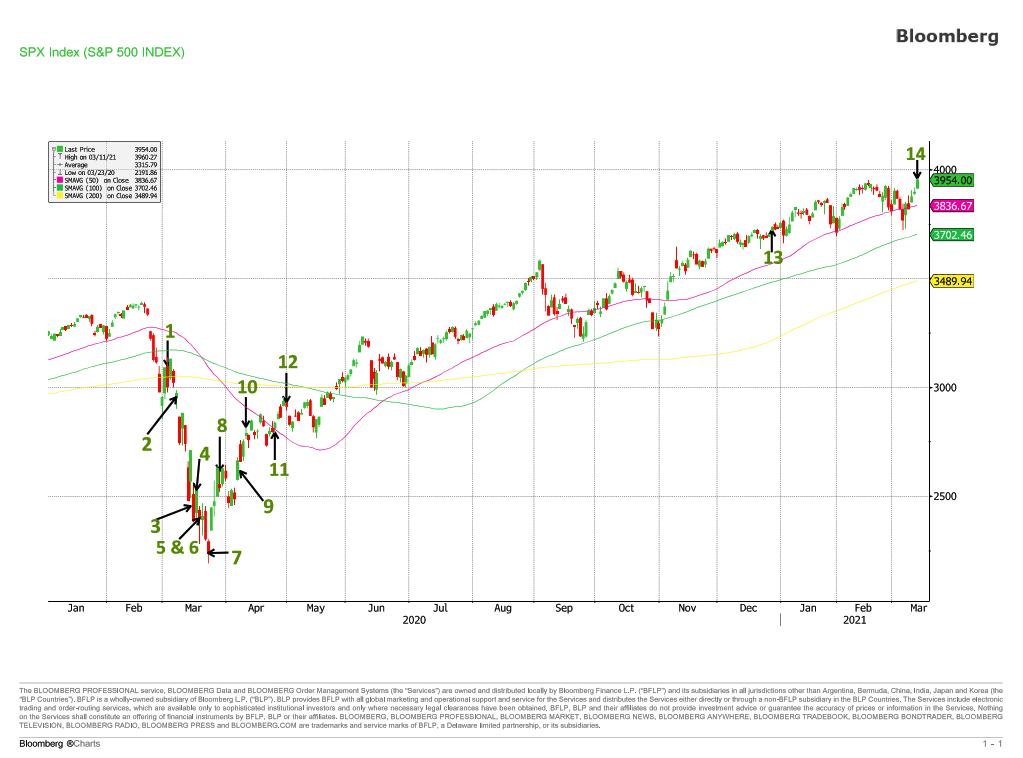
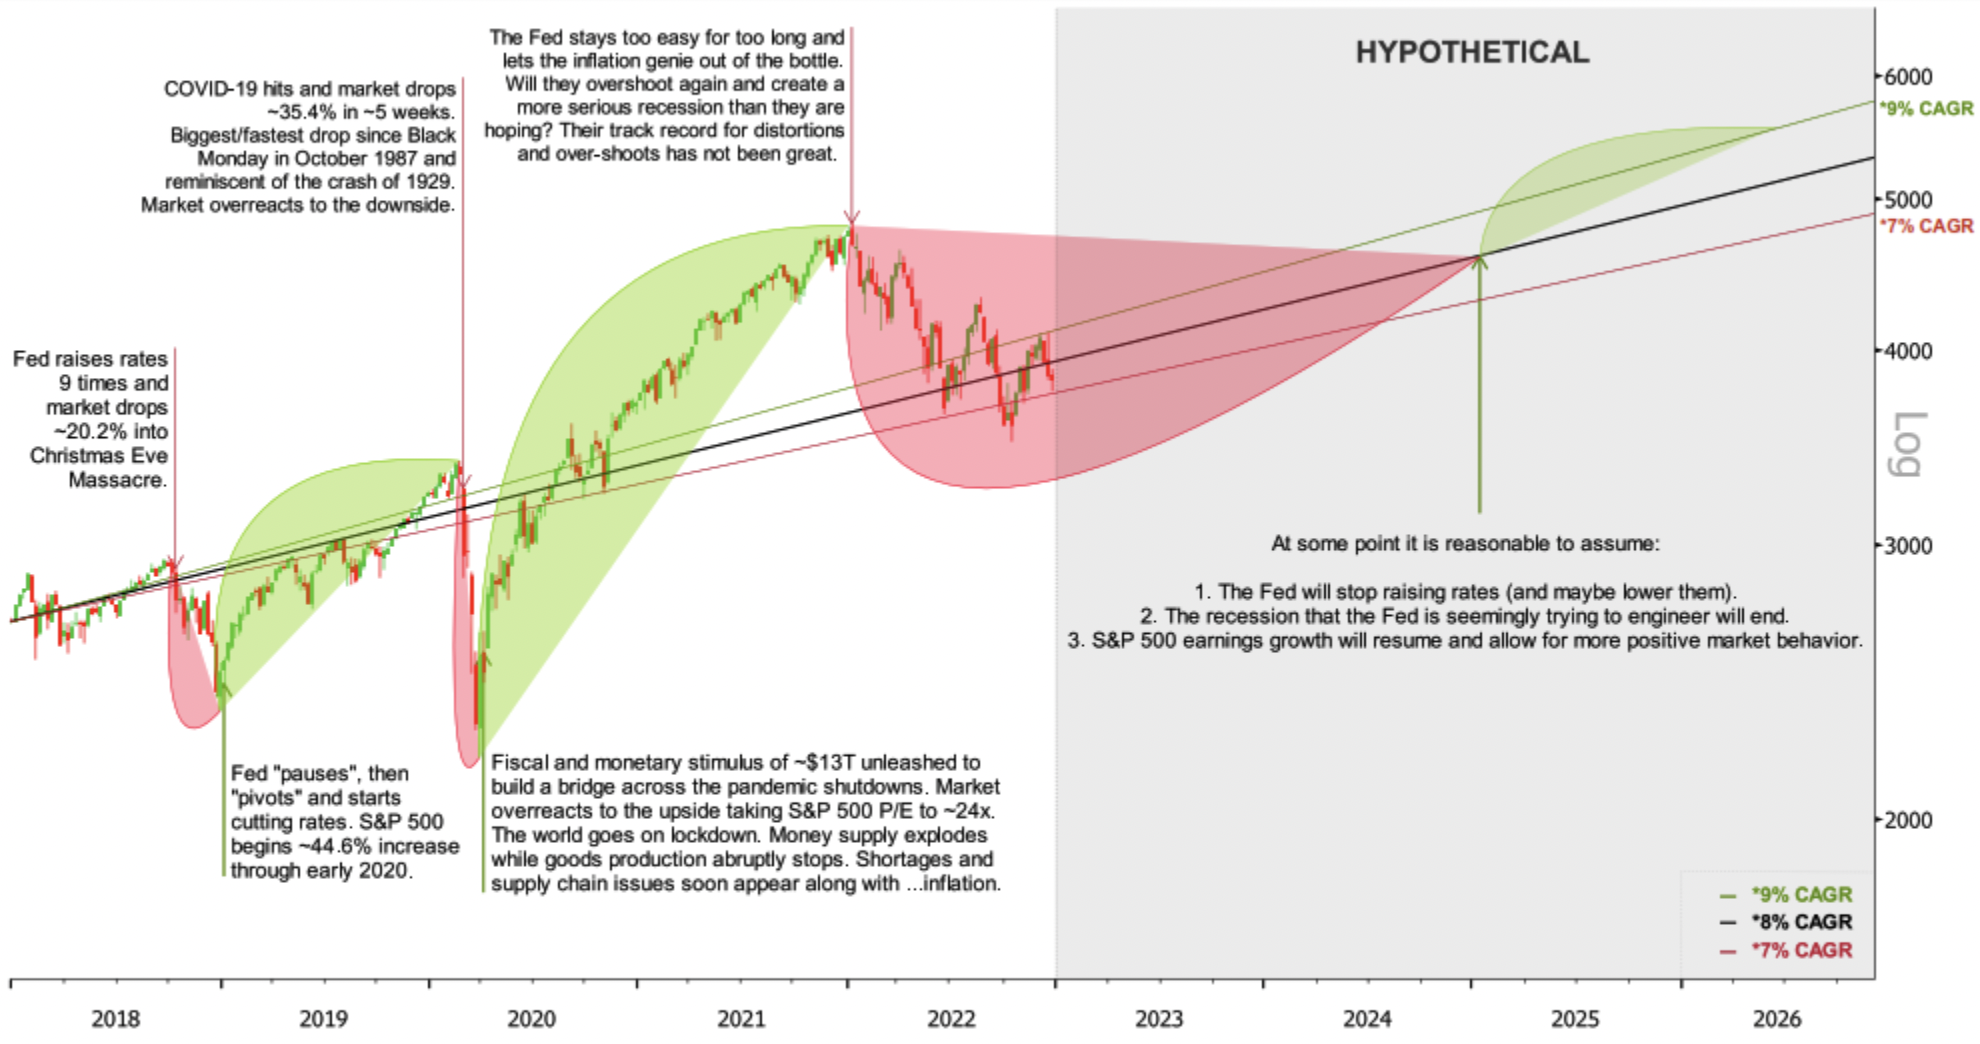 Figure 1 – Distortions & Overshoots: How Fiscal & Monetary Policy Has Created Massive Volatility
Source: S&P 500 data sourced from Bloomberg 12/20/22 with annotations and hypothetical analysis by Alpha Cubed Investments
By late 2018, the Fed had raised its target range for the Fed funds rate nine times from a low of 0.00-0.25% before December 2015 to 2.25-2.50% on December 19, 2018, and this long series of increases put a strain on the market. The S&P 500 began to waiver in late 2018, resulting in what I named the “Christmas Eve Massacre.” The S&P 500 dropped almost -20% from the high in October to the low put in on Christmas Eve, and the Fed listened to the message of the markets and executed their famous “pause,” then “pivot.” By January 2019, the Fed had signaled they were done raising rates, and the S&P 500 staged an impressive advance of over 40% that lasted until early 2020.
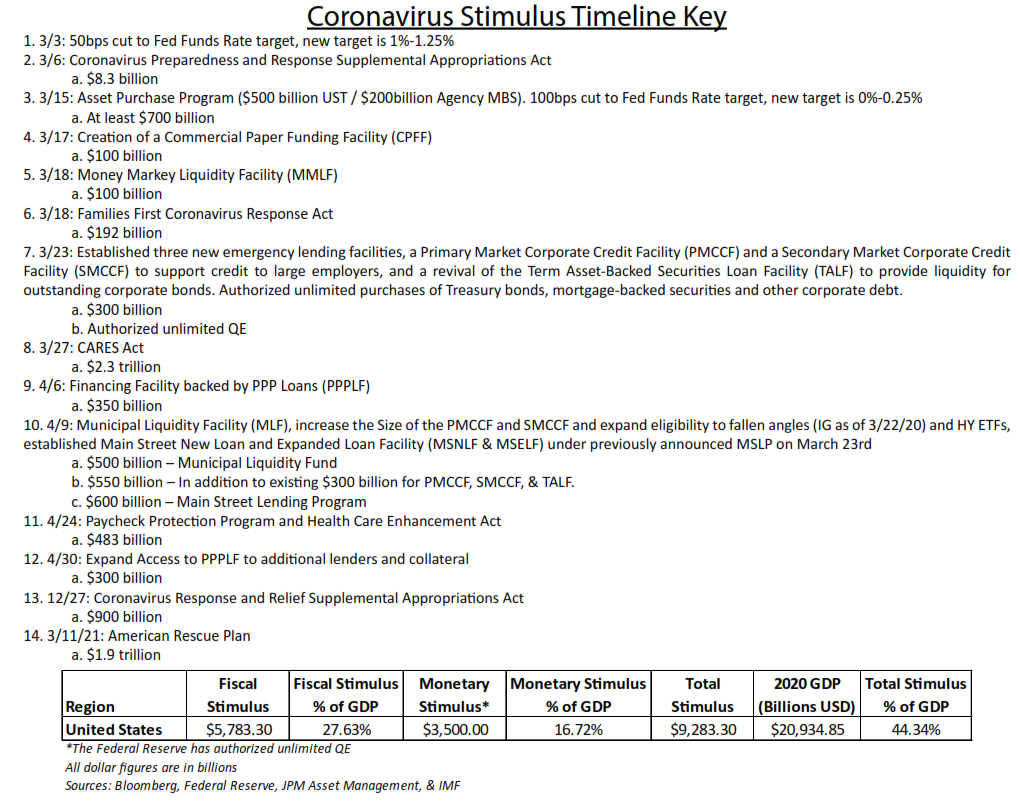
Things looked optimistic for the markets and the economy in general in early 2020. Expectations for another good year ran high, but then COVID-19 reared its ugly head, the U.S. (and the world) went on lockdown, and literally all hell broke loose. The S&P 500 suffered a 1930s, Great Depression-like drop of about -34% between February 19th and March 23rd, 2020. Volatility skyrocketed—stocks were seemingly in freefall, and bonds often did not have buyers. These market dislocations prompted the Federal Reserve to step into the breach to help build a bridge across the pandemic shutdowns, and they began cutting rates aggressively, quickly taking their target back to 0.00%. They also began a massive quantitative easing program by buying securities in the marketplace. Estimates of total stimulus between monetary and fiscal policy were about $13 trillion dollars, and as you can see from the chart below, the Fed’s balance sheet expanded aggressively beginning in March 2020. We have also included a chart at the end of this post showing total stimulus estimates over this time period.*
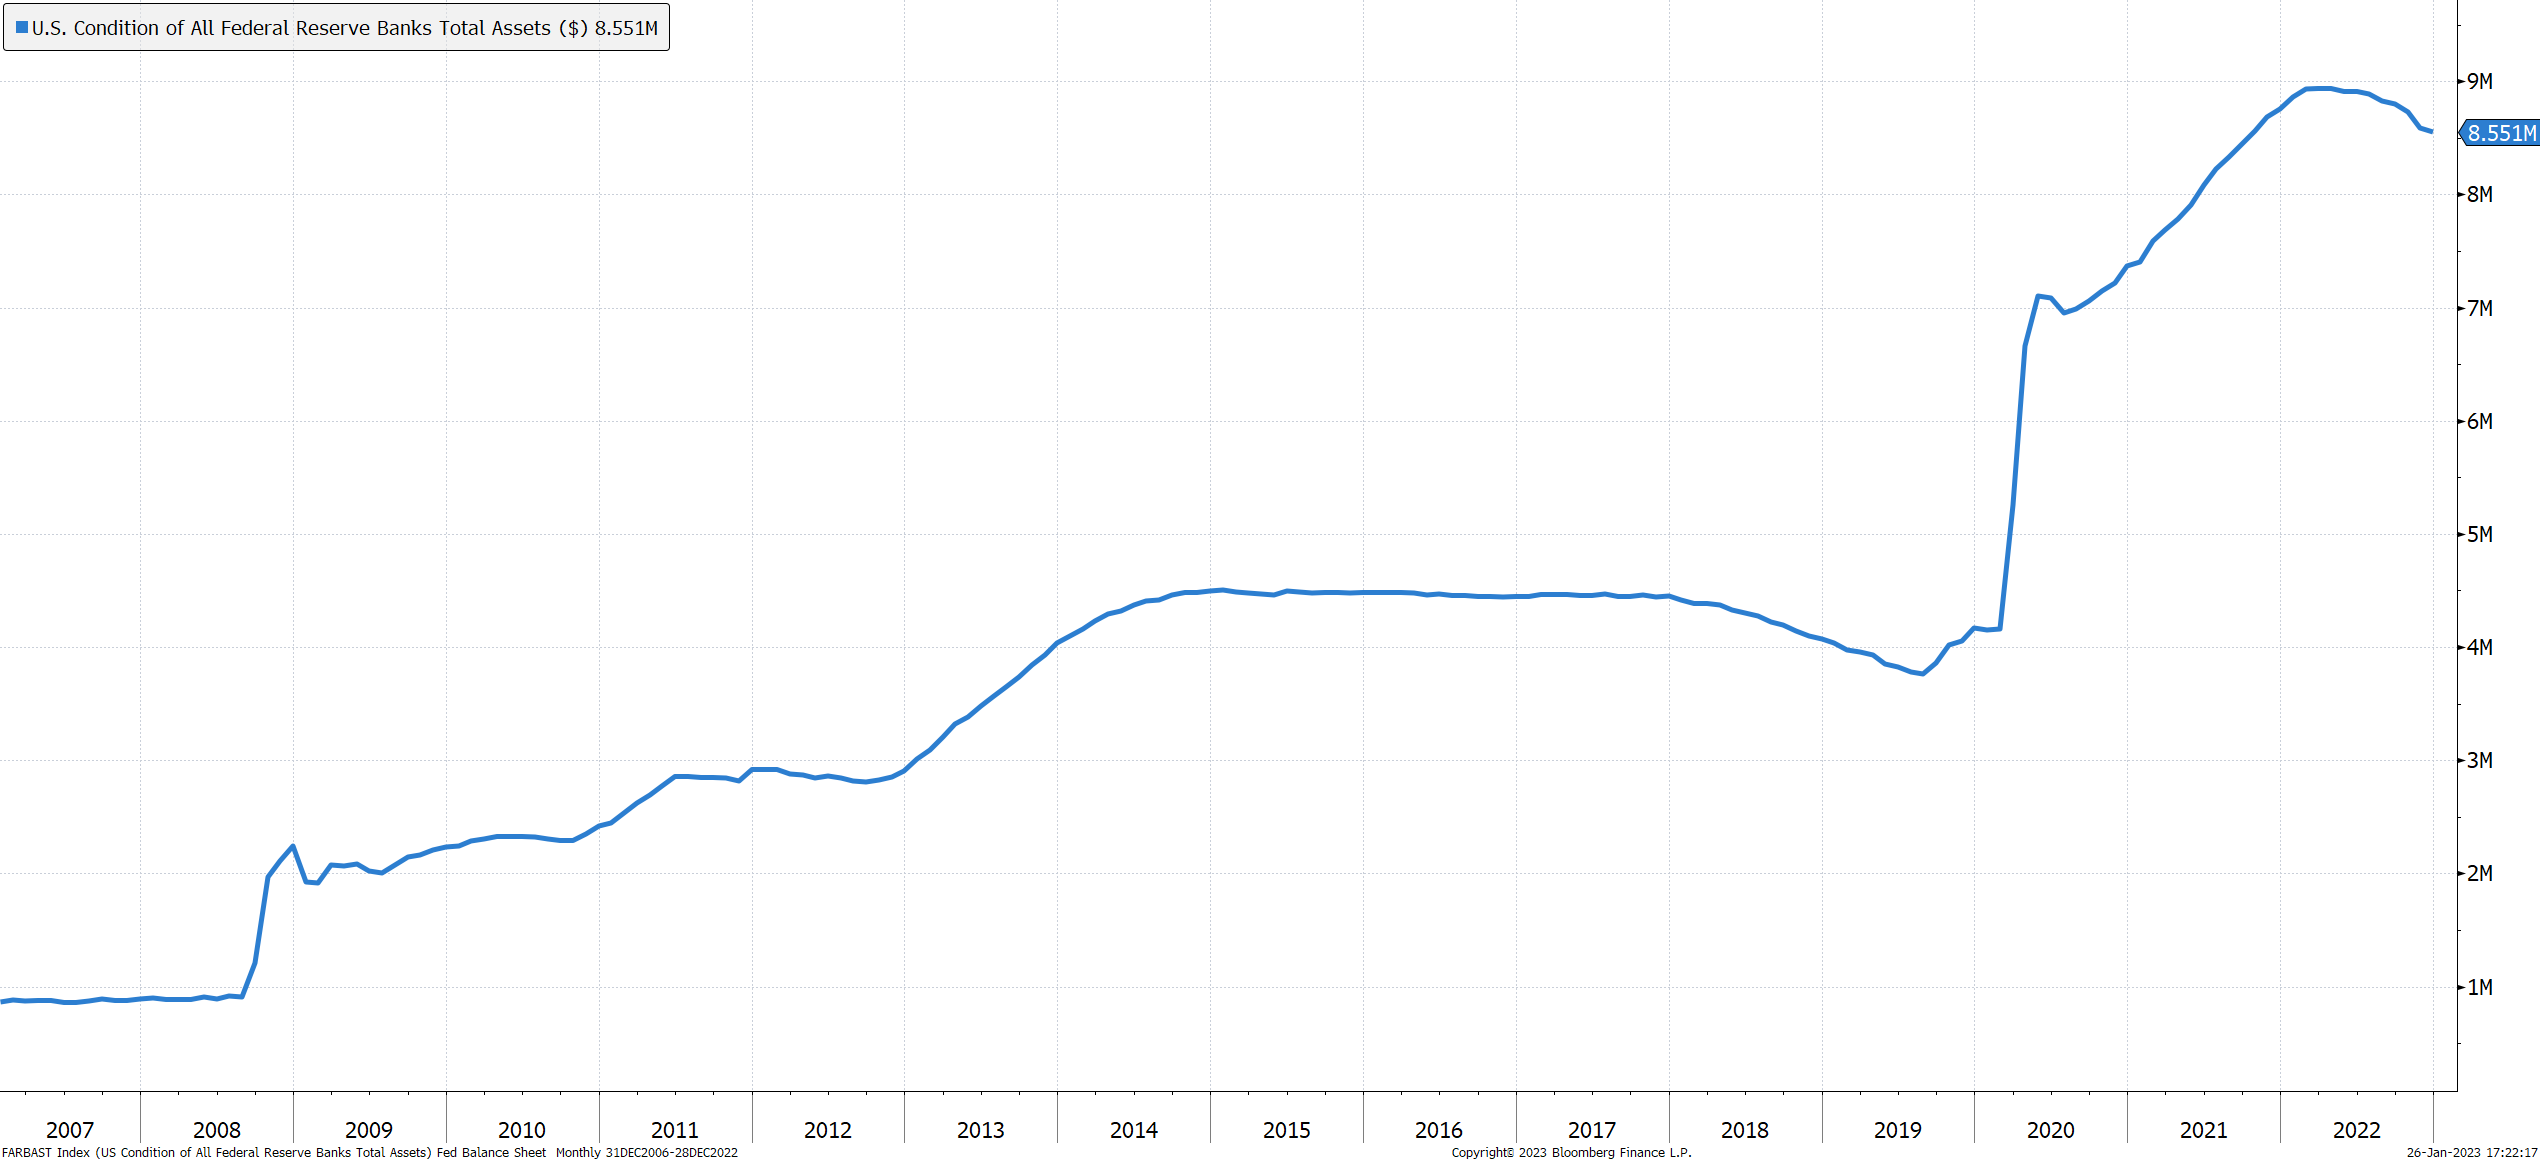 Figure 2 – Fed Balance Sheet
 Source: Federal Reserve, Bloomberg
This historic infusion of stimulus into the economy launched the S&P 500 on a massive run of about 119% from March 23rd, 2020 to December 31st, 2021. The Fed had fueled a significant market distortion to the upside, which saw rampant speculation in things like “meme” stocks, cryptocurrency, stay-at-home stocks, and various other forms of speculation. Through all of 2021, even as the effects of the pandemic were easing, the Fed took no action to reverse course and rein in the massive stimulus they had unleashed.
The definition of inflation is too much money chasing too few goods and services, so unleashing a historic amount of stimulus while telling everyone to stay home and not work unsurprisingly caused inflation to bubble up to the surface. The Fed initially took the position that the inflation we were seeing in the economy was “transitory” and that it would dissipate as supply-chain issues abated and more people went back to full-time work. However, by late 2021, it became clear that the inflation was structural, and something needed to be done to combat it. Poor Janet Yellen, Secretary of the Treasury, was hauled into the White House to explicitly say she was sorry, that they got it wrong, and that inflation was not transitory. Jerome Powell, Chairman of the Federal Reserve, was hauled before Congress to explain how he got it so wrong and was pilloried for his mistake. By taking no action to withdraw the record stimulus throughout all of 2021, the Fed was seen to have made a major policy mistake that let the structural inflation genie out of the bottle.
That brings us to our current situation. After contributing to structural inflation and rampant speculation in the stock market by leaving rates “too low for too long,” the Federal Reserve had to act quickly and decisively by raising rates at the fastest pace in history. As of this writing, we have had seven rate hikes from a range of 0.00-0.25% before March 2022 to 4.25-4.50% in December 2022 with additional hikes expected. The chart below shows the relative speed with which this has happened compared to other tightening cycles.
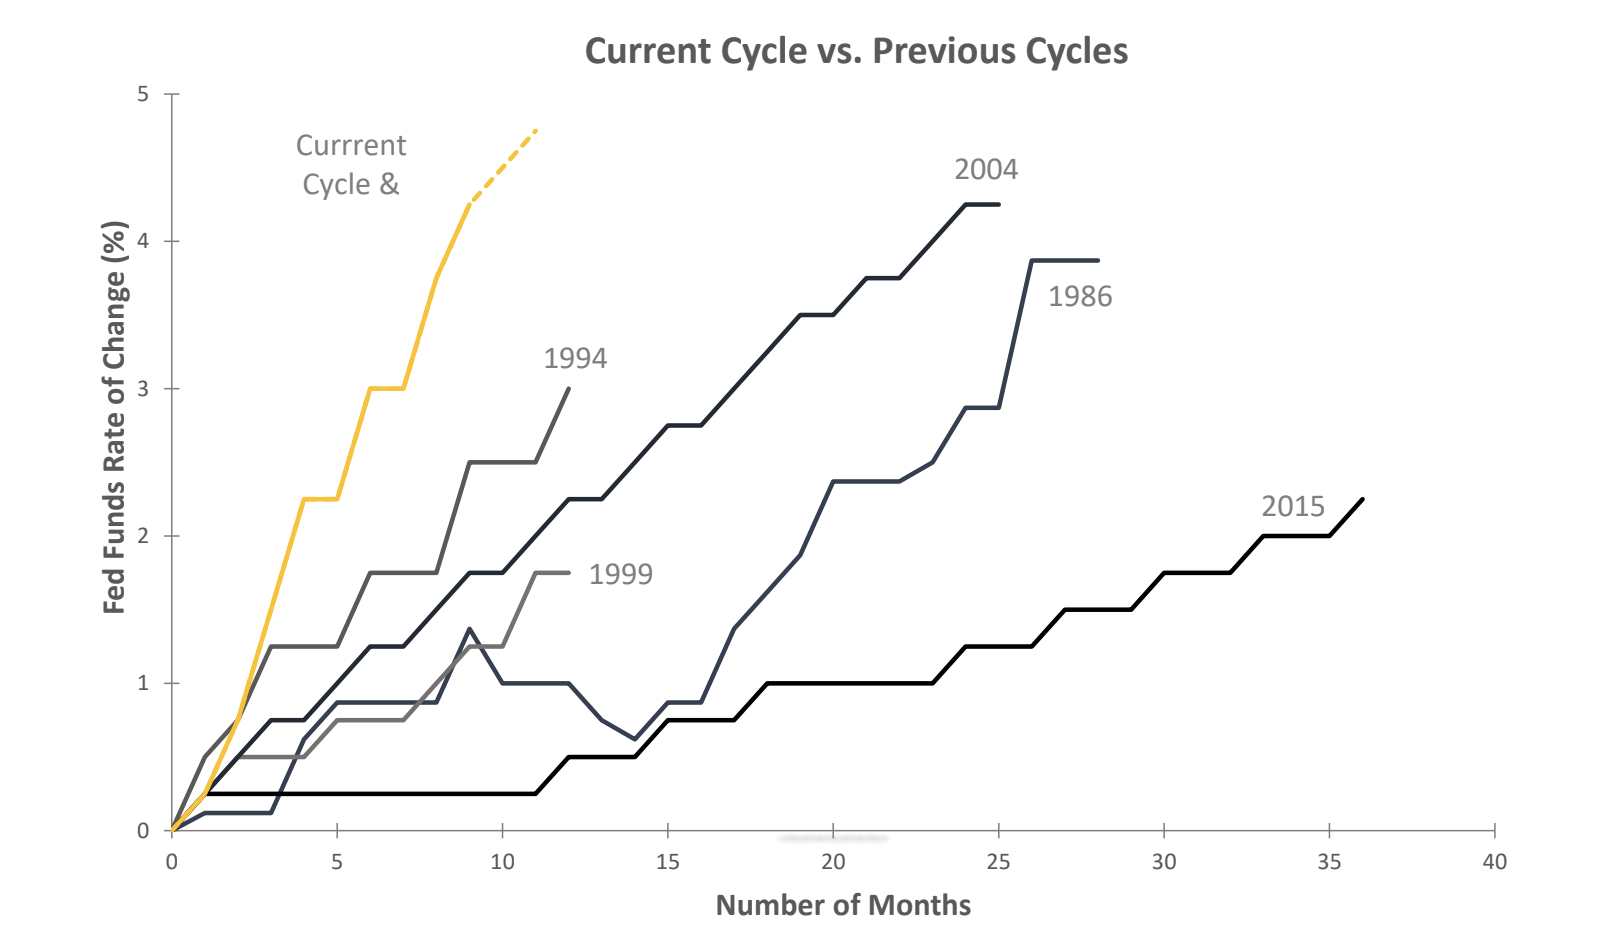 Figure 3 – Fastest Tightening Pace Since 1980s
Source: FRED, Bloomberg
The Fed cannot afford to lose more credibility after such an egregious mistake in 2021. Because of this, they are risking pushing the U.S. into some level of recession, and we have seen the markets reprice down to adjust to this new, tighter monetary environment. The S&P 500 dropped almost -20% in 2022, and the NASDAQ Composite dropped over -30%. The Fed had to take an aggressive stand against the threat of ongoing structural inflation despite these risks. I often think of Jerome Powell as Clint Eastwood in the 1966 spaghetti western, The Good, The Bad, and The Ugly, standing tall and not willing to flinch until he is sure the inflation monster is dispatched back into its hole.
 Figure 4 – Still from The Good, The Bad, and The Ugly
This need to stand firm against inflation may result in further distortions and overshoots, as the Fed may end up staying too tight for too long, exacerbating a potential recession and associated market selloff. According to Atlanta Fed President Raphael Bostic, research shows that monetary policy can take 18-24 months before it materially affects inflation and the broader economy, and the Fed only began hiking rates in March 2022, a mere 10 months ago. This means that we have not yet seen and likely will not see for some time the full weight of these cumulative rates hikes.
A good example of the lag effect is unemployment. One of the central fears around inflation is the wage-price spiral, wherein workers receive a pay raise that they have demanded to keep up with inflation; then, with those higher wages, they demand more goods and services, which in turn causes prices to rise. This is why the Fed tracks unemployment closely, looking for it to begin rising to take the threat of a wage-price spiral off the table. However, employers are extremely disincentivized to fire employees, since great workers are hard to replace. That is why it can take a longer and/or a more severe recession to see unemployment start ticking up meaningfully. Unfortunately, by this time, it can be harder to reverse the overall economic effects of the recession. As you can see, attaining a soft landing in the face of all these variables is a difficult goal to achieve. Here is where we stand on unemployment right now:
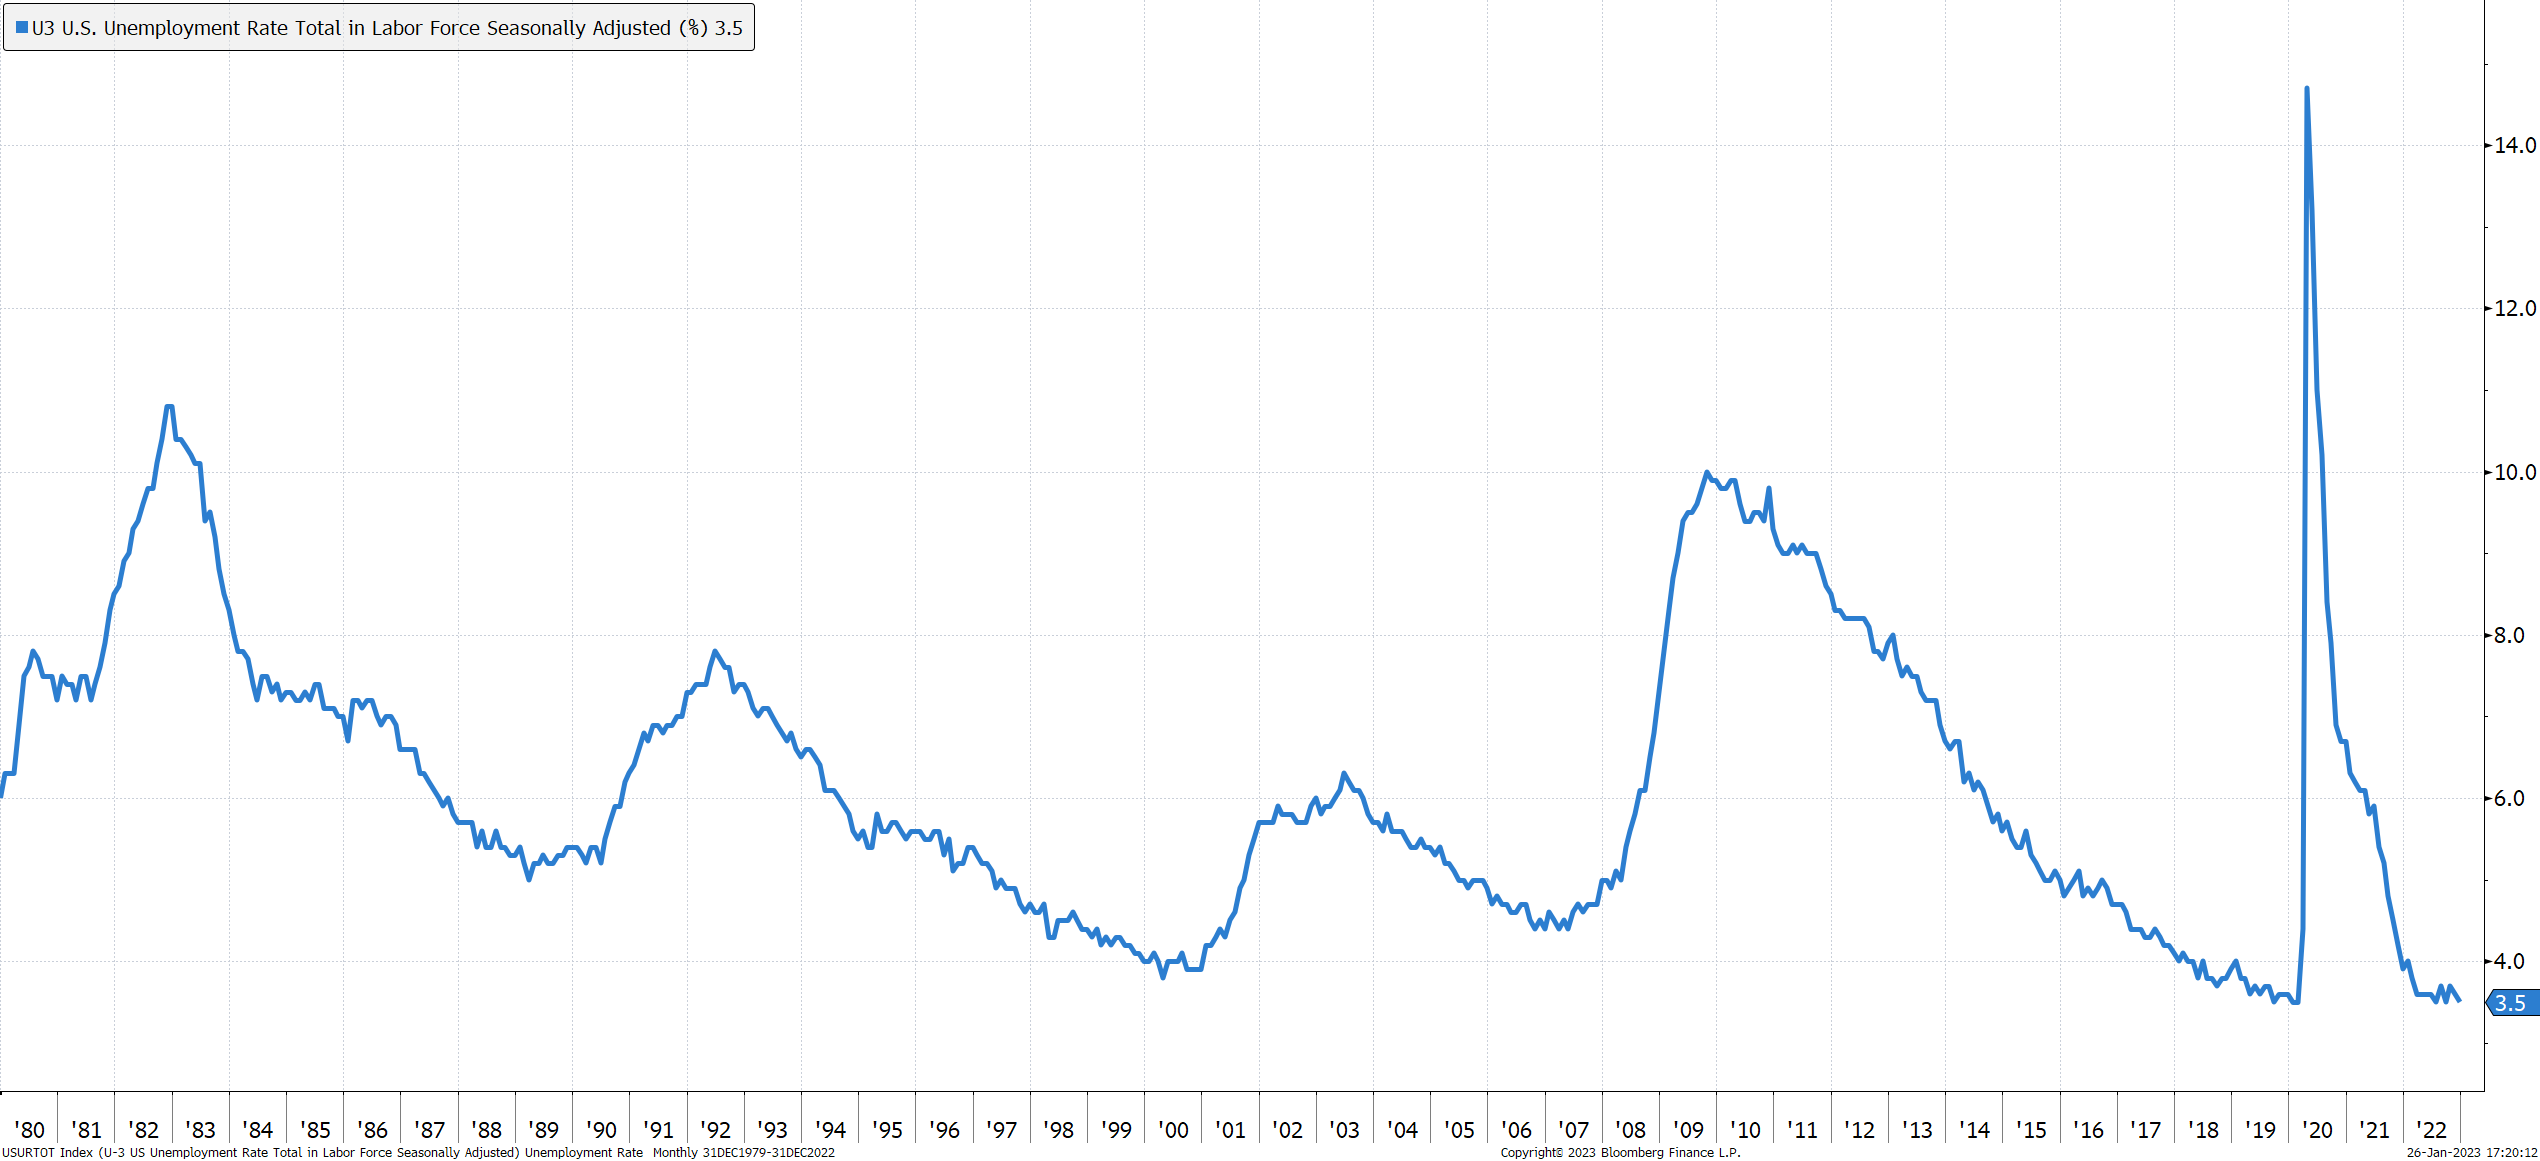 Figure 5 – Unemployment Rate
Source: Bureau of Labor Statistics, Bloomberg
While all of these and many other variables will come into play as we navigate the current inflation and recession concerns driving markets at this time, we must remember to “not fight the Fed.” At some point, it is extremely reasonable to envision a time when:
- inflation is brought under control,
- the Fed stops raising rates,
- the Fed actually lowers rates, and
- S&P 500 earnings growth resumes.
While these conditions may not all materialize this year, we suggest managing your portfolio as though they will over time. It is also important to remember that none of this is a foregone conclusion. Markets can go higher well in advance of the lows of a recession as they anticipate better days ahead. That is why maintaining a strong, diversified portfolio over time generally makes sense while “going to 100% cash” is a risky strategy that implies perfect timing both on the way out and on the way in. Understanding that the actions of the Fed drive a large portion of overall market behavior can be a huge benefit if we stay on the same page as the Fed. Being “on cycle” suggests generally using market volatility to add to strong companies when others are afraid and prices are lower. This dynamic approach can help improve returns in challenging and volatile markets. We will continue to pursue this as our base case as we navigate these challenging markets.
Additional Source Data
Source for Federal Reserve data: https://www.federalreserve.gov/monetarypolicy/openmarket.htm
*Pandemic-related stimulus overview
Disclaimer: Alpha Cubed Investments, LLC (ACI) is a Registered Investment Adviser. This information and brochure is solely for educational purposes. Advisory services are only offered to clients or prospective clients where ACI and its representatives are properly licensed or exempt from licensure. Past performance is no guarantee of future returns. Any hypothetical statements or projections are theoretical in nature only and are unlikely to happen in the precise manner shown and are for illustration and educational purposes only. Investing involves risk and possible loss of principal capital. Please see our firm ADV for more information. No advice may be rendered by ACI unless a client service agreement is in place. Some of the research and ratings shown in this presentation come from third parties that are not affiliated with ACI.
Historical performance results for investment indices and/or categories generally do not reflect the deduction of transaction and/or custodial charges or the deduction of an investment-management fee, the occurrence of which would have the effect of decreasing historical performance results. Economic factors, market conditions, and investment strategies will affect the performance of any portfolio, and there are no assurances that it will match or outperform any benchmark. The Standard & Poor’s 500 Index is a market capitalization-weighted index of 500 large U.S. publicly traded companies by market value. The S&P 500 is one of the most common benchmarks for the broader U.S. equity markets. Indices are unmanaged, do not incur fees and expenses, and cannot be invested in directly. Indices do not reflect the payment of advisory fees and other expenses associated with an exchange-traded fund. The information is believed to be accurate but is not guaranteed or warranted by Alpha Cubed Investments. Content, research, tools, and stock option symbols are for educational and illustrative purposes only and do not imply a recommendation or solicitation to buy or sell a particular security or to engage in any particular investment strategy.